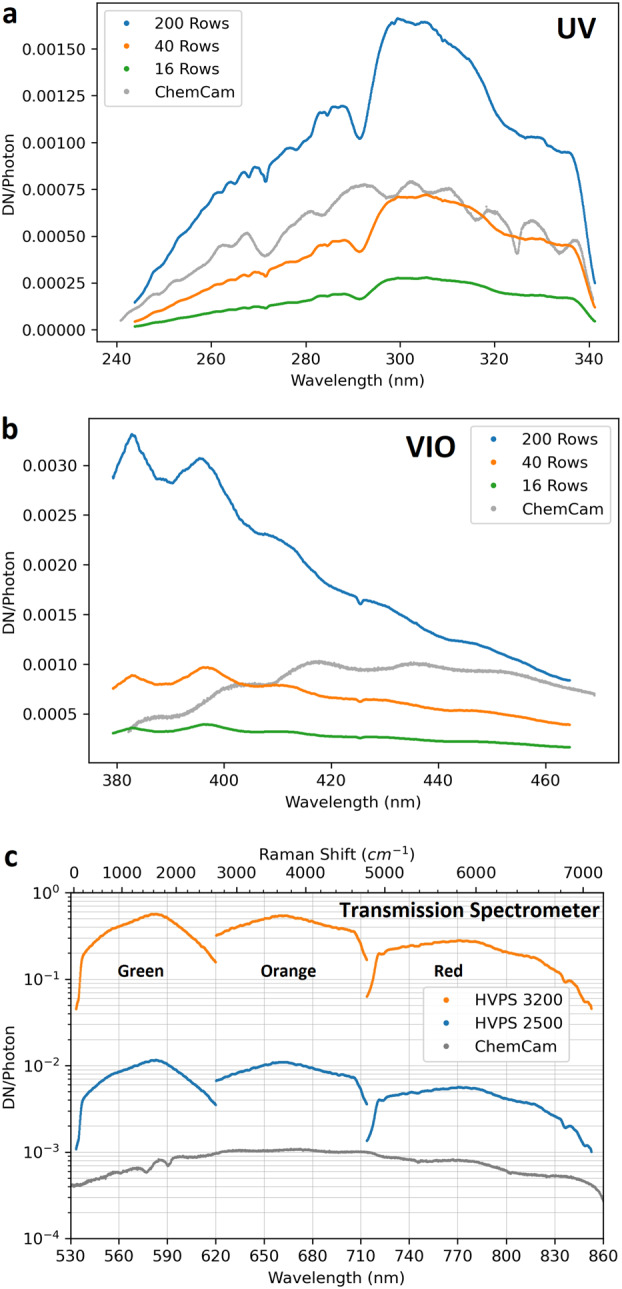
Fig. 36.

Preliminary instrument optical response functions for the SuperCam BU UV (a), VIO, (b), and transmission (c) spectrometers. The units are digital numbers (DN) per photon incident at the telescope aperture. Data were taken with the instrument mounted in the rover. For the reflection (UV, VIO) spectrometers, read-out of fewer CCD rows results in a lower optical response that can be used to avoid saturation for nearby targets. For the transmission spectrometer (c), a large range in response is needed to accommodate both bright LIBS signals and weak Raman signals. A log scale is used to present the gain settings planned for LIBS (2500) and Raman spectroscopy (3200). The response curves of the transmission spectrometer clearly show the three different (green, orange, red) optical windows, with dips in response at the transition regions. The exact position of the transition was selected to avoid any important LIBS emission peaks. ChemCam’s instrument response (Wiens et al. 2012) is shown for comparison. ChemCam is limited to 14-bit numbers, in contrast to SuperCam’s 16 bits
