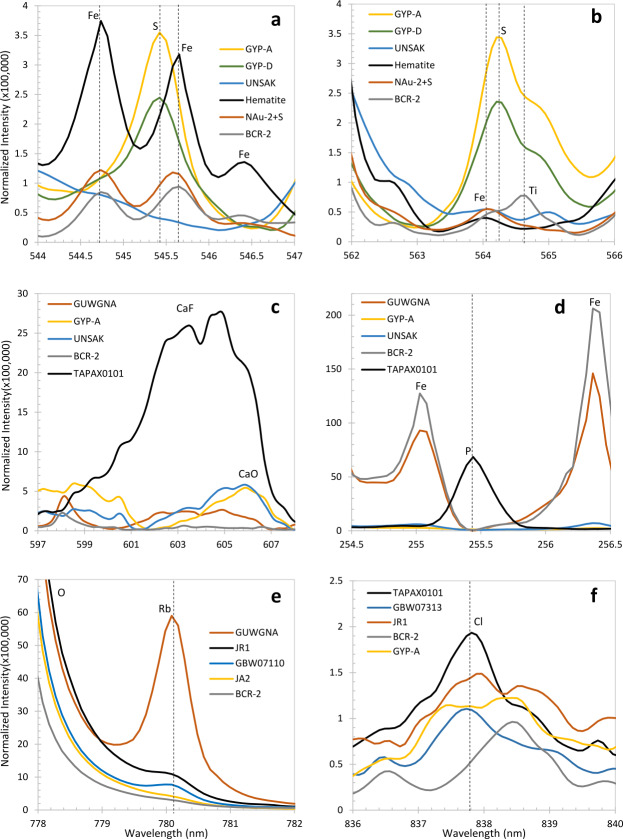
Fig. 41.
LIBS spectra highlighting various spectral features of interest. The S II 545.5 nm (a) and S II 564.2 nm (b) peaks are present in gypsum standards GYP-A (46.2 wt.% ) and GYP-D (36.70 wt.% SO3). Fe peaks are also present in this region as demonstrated by an oolitic hematite (74.96 wt.% total iron as FeO), a sulfur doped Fe-rich nontronite clay (NAu2 plus added sulfur, 15.76 and 21.07 ), and a basalt (BCR-2, 12.42 wt.% and 0.04 wt.% ). Note the NAu2+S spectrum has an unresolved peak between S and Fe with the skew to the left indicating the presence of sulfur, as opposed to the peak in BCR-2, which is not skewed. UNSAK (aragonite) has very low and , 0.11 and 0.12 wt.%, respectively. (c) CaF molecular features (appearing as a very broad peak) are present in apatite standard TAPAX0101 and slightly in GUWGNA (granite with 33,200 ppm F and 0.64 wt.% CaO). CaO molecular features are present in gypsum (GYP-A) and aragonite (UNSAK). No features are present in the basalt (BCR-2). (d) A P peak is present in the apatite (TAPAX0101) but not in the other shown spectra, which have low to no P. (e) Rb peak on the upper side of a major O peak. The spectra are arranged in descending order of Rb concentration: GUWGNA (Granite) = 2020 ppm, JR1 (rhyolite) = 257 ppm, GBW07110 = 183 ppm, JA2 = 71 ppm, BCR-2 = 47 ppm. (f) Cl peaks with the spectra arranged in descending order of Cl concentration: TAPAX0101 (apatite) = several wt.%, GBW07313 (marine sediment) = 40,700 ppm, JR-1 (rhyolite) = 920 ppm, BCR-2 = 98 ppm, and GYP-A = 12 ppm

