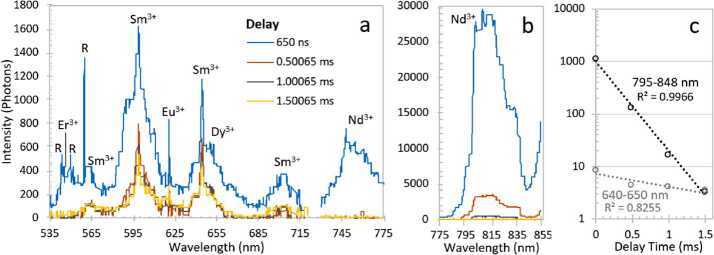
Fig. 50.
Luminescence spectra of an apatite sample from Durango, Mexico, from 535–775 nm (c) and 775–850 nm (b); note the difference in intensity between these two regions. A small portion of the spectra around 720 nm have been removed due to excess noise where two spectral windows are joined. Each spectrum is the average of 50 laser shots with a gate width of 0.5 ms. Four time delays starting in the Raman window (650 ns delay) were taken with a 0.5 ms step size. Raman features (marked with an “R”) are present in the first time delay. The other features are attributed to rare-earth element luminescence. (c) shows lifetime curves based on the sum of the intensities in the regions between 640–650 nm () and 795–848 nm (); the sums have been divided by 10,000 and plotted on a semi-log scale for clarity

