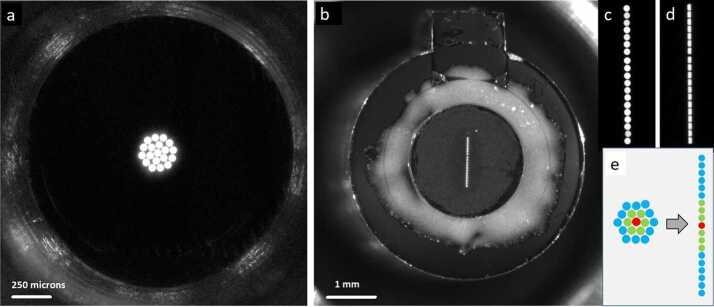
Fig. 9.
Typical inspection images of demultiplexer end (a) and spectrometer end (b) of fiber bundles, showing the one feeding the transmission spectrometer. The core of each fiber is 50 μm diameter. Fibers are backlit for the inspections. The relative intensity of each fiber may be a function of the position of the lamp, and so does not indicate relative throughput in this case. Inset shows a magnified image of the linear array of fibers at the spectrometer end before (c) and after (d) bonding a 28.7 μm slit. Inset (e) shows the mapping of fibers in the array, with central fibers in the circle mapped to central fibers in the line

