
Figure 1.
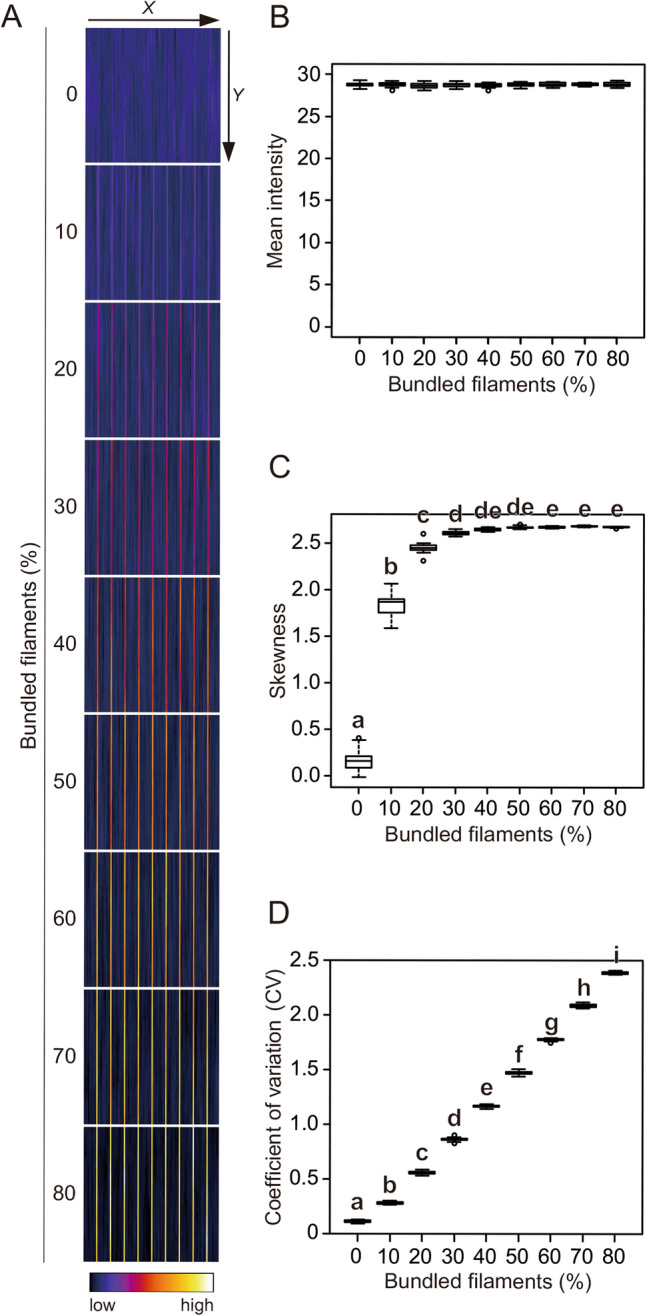
Evaluation of filament bundling in synthetic images. (A) Representative synthetic images of virtual cytoskeleton bundling. The images were built by adding filaments with constant intensity and length at random positions. To mimic bundles, the positions of the filaments on the X-coordinate were restricted to 1/20 for different percentages of the filaments (0–80%). (B) Mean intensity of the images. (C) Skewness of the intensity distribution. (D) CV of the intensity distribution. Significance was tested using the Tukey–Kramer test (P < 0.01). Different lowercase letters indicate significant differences. N = 20.