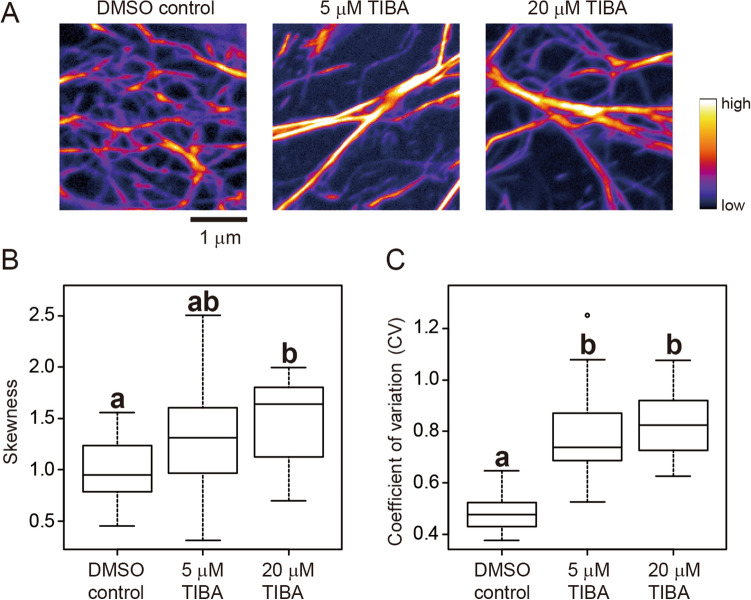
Figure 5.
Evaluation of actin filament bundling in confocal laser scanning microscopy (CLSM) images. (A) Representative CLSM images of GFP-ABD2-labeled actin filaments in hypocotyl cells of A. thaliana plants. Actin filaments treated with DMSO (control), and 5 μM and 20 μM TIBA, an actin filament bundling agent, are shown. Scale bar indicates 1 μm. (B) Skewness of the intensity distribution. (C) CV of the intensity distribution. Significance was tested using the Tukey–Kramer test (P < 0.01). Different lowercase letters indicate significant differences. N = 24.

