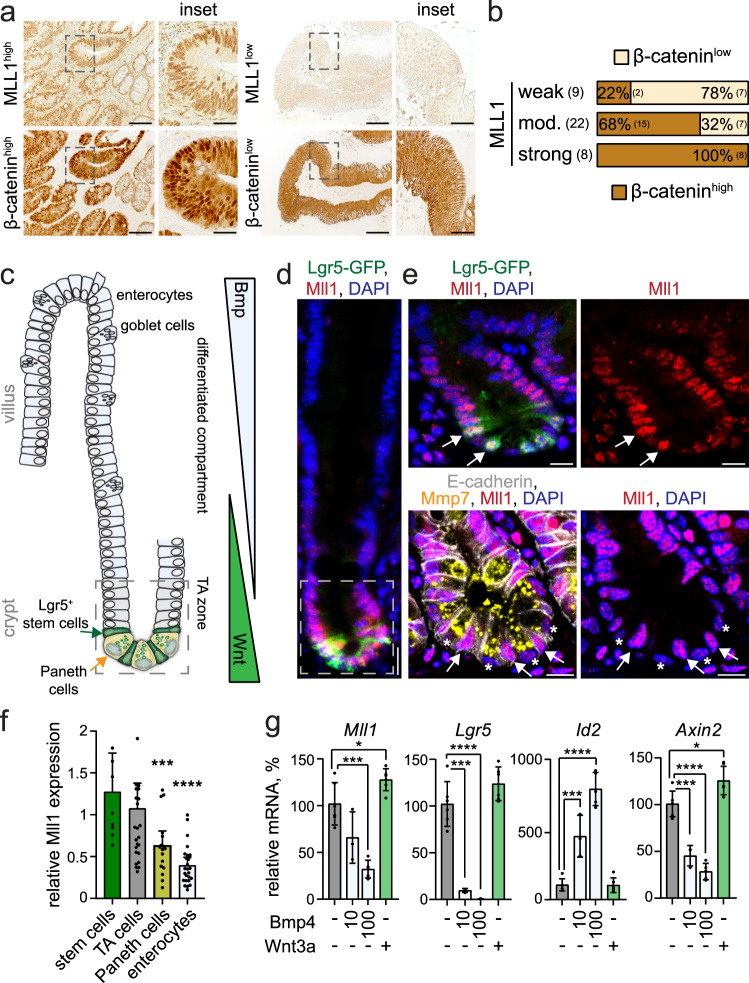
Fig. 1. High Mll1 expression in colon carcinomas and Lgr5+ intestinal stem cells.
a Immunohistochemistry for MLL1 (upper panel) and β-catenin (lower panel) of colon cancer patient biopsies, tumor stage T0, scale bar 50 µm. Insets on the right, scale bar 20 µm. Stainings were performed on eight independent biopsies. b Quantification of nuclear β-catenin staining in tumors with strong, moderate, and weak expression of MLL1, scored as low and high across all tumor stages, n = 39 biologically independent colon cancer specimen. Chi-square test for significance, χ2 = 11.5, p = 0.0032. c Scheme of the murine small intestine crypt–villus axis63. In the lower crypt, Lgr5+ stem cells (green) intersperse between Paneth cells (yellow). Stem cells produce progeny that proliferate and differentiate in the transit-amplifying (TA) zone. Terminally differentiated cells, e.g. enterocytes and goblet cells, move into the villus. Opposing gradients of Wnt and Bmp signaling specify proliferation and differentiation along the crypt–villus axis. d Representative immunofluorescence staining for Mll1 (red) on the small intestine of Lgr5-GFP mice reveals a gradual decrease in Mll1 expression from the crypt to villus. Stem cells marked by Lgr5-GFP (green), nuclei in blue (DAPI), scale bar 20 µm. Stainings were performed in five independent mice. e Magnification of the crypt region; upper panel, arrows mark stem cells with high Mll1 expression (red); bottom panel, asterisks mark Paneth cells stained by Mmp7 (yellow) with low Mll1 expression. E-cadherin (white) stains cell borders. Nuclei in blue (DAPI), scale bar 10 µm. f Quantification of Mll1 staining intensity in nuclei of crypt and villus cells, normalized to the mean Mll1 expression in TA cells located just above the stem cell niche (up to relative + 8 position), quantified from independent stainings of five mice. Data are presented as mean values ± 95% confidence interval, outliers are shown as single dots. Mann–Whitney test (two-tailed) for significance relative to stem cells, ***p = 0.0009, ****p < 0.0001. g Mll1, Lgr5, Id2, and Axin2 mRNA expression in intestinal organoids of mice treated with 10 ng/ml and 100 ng/ml Bmp4 and 0.66 µg/ml recombinant Wnt3a for 24 h, n = 6 independent experiments for control and Wnt3a, n = 3 for 10 ng/ml Bmp4, n = 5 for 100 ng/ml Bmp4, two-tailed unpaired t-test, Mll1 *p = 0.0329, ***p = 0.0001; Lgr5 ****p < 0.0001, ***p = 0.0004; Id2 ****p < 0.0001, ***p = 0.0008; Axin2 *p = 0.0136, ****p < 0.0001, ***p = 0.0005. Data are presented as mean values ± SD. Source data are provided as a Source Data file.

