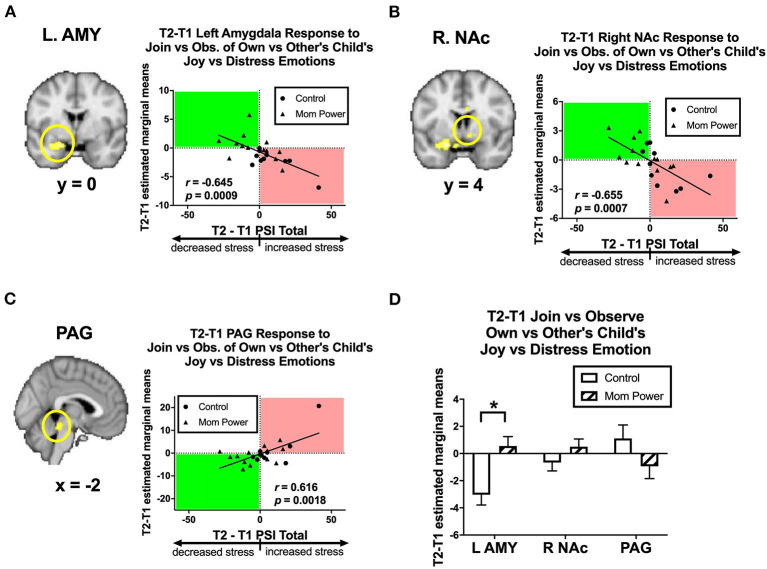
Figure 9.
From T1 to T2 in the clinical study sample, the T2-T1 differences in parenting stress index (dPSI) were negatively associated with the concomitant increases in the MMR(j-d) [Join[Own vs. Other Child's Joyful vs. Distressed] vs. Observe[Own vs. Other Child's Joyful vs. Distressed]] differential responses in the left amygdala (A) and right NAc (B), but they were positively associated with that in the PAG (C), each with the dPSI depicted on the x-axis, against the T2-T1 difference in the region's differential response on the y-axis, in the scatter plots. The Pearson's correlation r scores and p-values are embedded in the plots. The MP vs. Control differed in the MMR(j-d) in the left amygdala, but not the right NAc and PAG, with the bar charts of each region's mean (±s.e.) depicted in (D). *p < 0.05.

