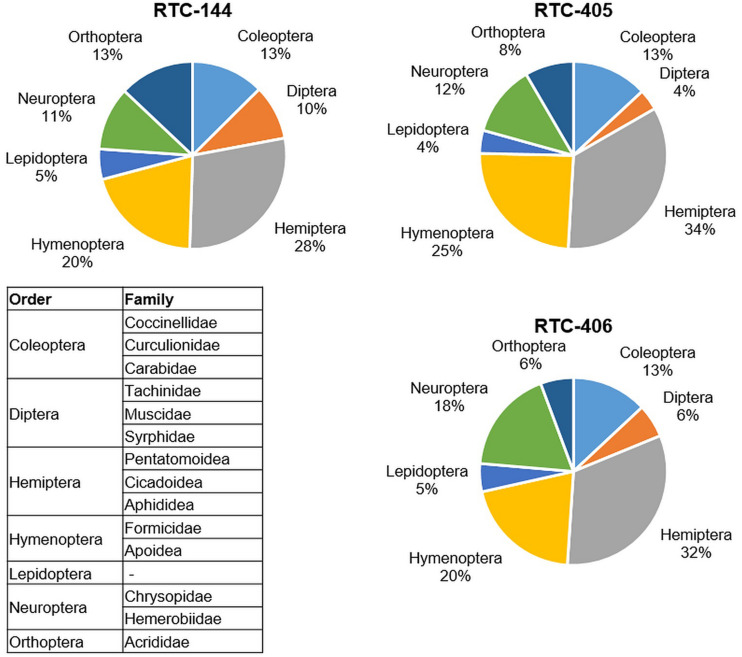
FIGURE 1.
Insect abundance on the three tef accessions from the field survey. Pie chart of the insects that were collected in three locations in the field (total of 3 m2 and normalized to 1 m2) sorted by orders. The insect families monitored in each order are included in the table. Sampling was performed prior to flowering (late May 2019).

