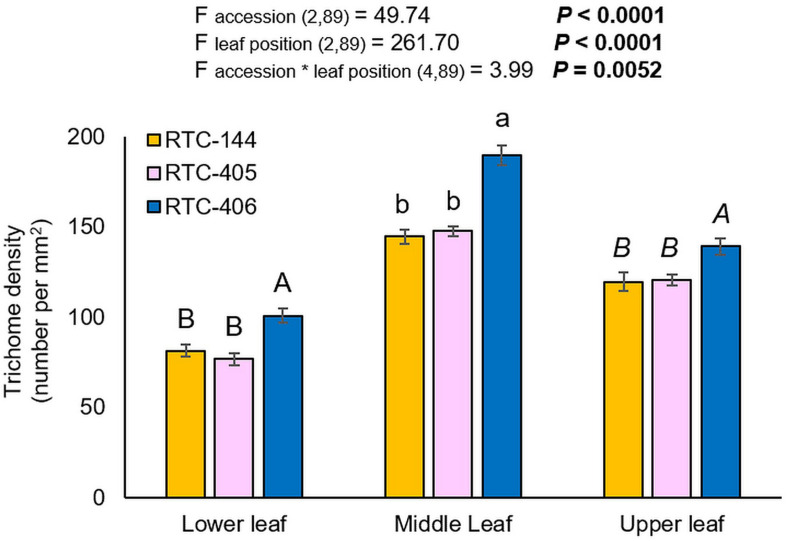
FIGURE 3.
Trichome density of three tef leaves. Bars represent the average number of trichome density per mm2 (mean ± SE, n = 10). On the top, a summary of the two-way ANOVA, comparing the number of trichome among the three accessions at three leaf sections (p < 0.05). Different letters above the bars indicate significant differences, using one-way ANOVA followed by TukeyHSD test separately for each time point, corrected with the false discovery method.

