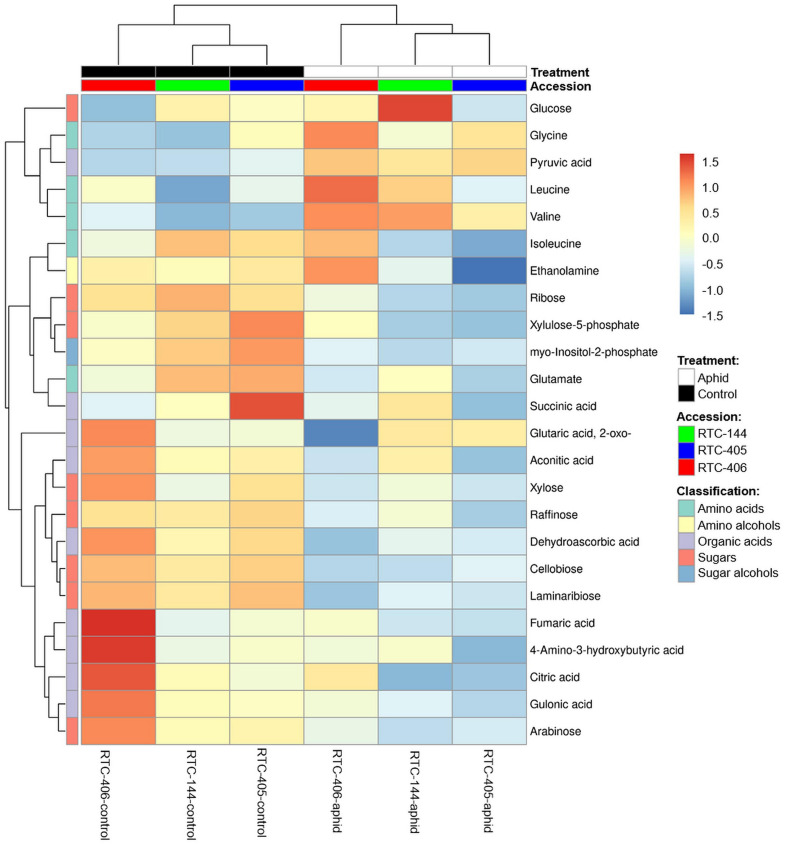
FIGURE 5.
Heatmap of the central metabolites profile of aphid-infested and untreated control tef plants. The Euclidean distance with Ward’s minimum variance method was calculated using the default parameters of the MetaboAnalyst software, and the graph created in R. Colors correspond with concentration values (autoscale parameters), where red indicates high levels and blue indicates low levels (n = 4–5 biological replicates).

