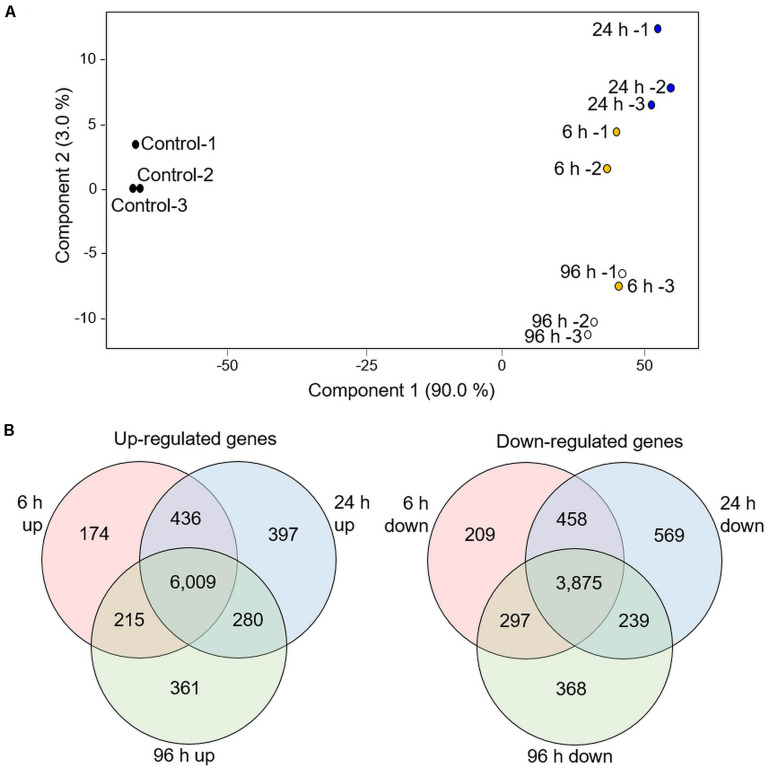
FIGURE 6.
Transcriptomic overview of RTC-144 tef leaves infested with R. padi aphid for different periods. (A) PCA plot was generated using 35,284 genes. (B) Venn diagram illustrating the number of genes up- or down-regulated by aphid infestation in the time course. p < 0.05 FDR, and absolute fold change > 2 (n = 3 biological replicates for each time point).

