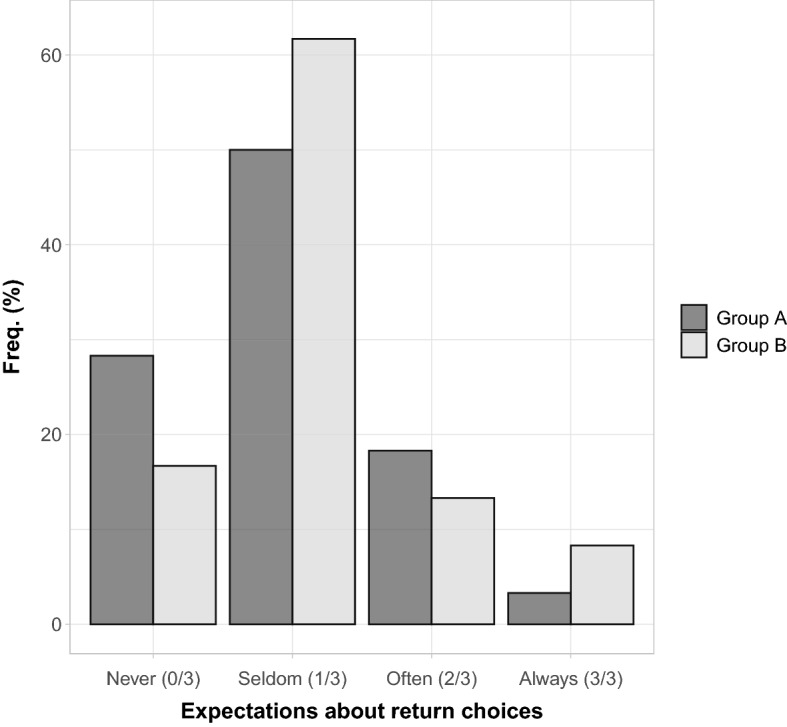
Fig. 3.

First-order expectations about dictator’s Return. The barplot shows the distribution of expectations over distinct return frequencies, from Never (0 returns in 3 rounds) to Always (3 returns in 3 rounds). As an example, the height of the bar in correspondence to Never captures the relative share of individuals believing that a generic dictator will never return the wallet. Different shades of gray identify the two groups in the experiment
