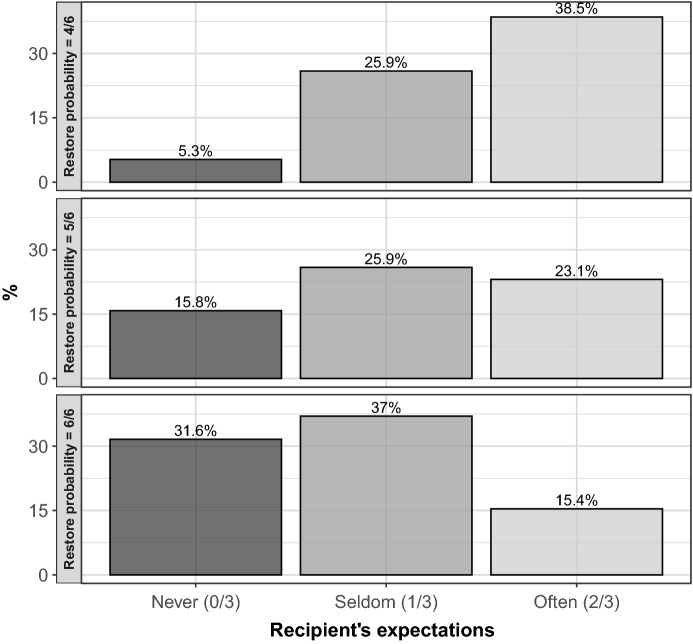
Fig. 4.
Return choices by recipient’s expectations and restoring probabilities. Each barplot provides a representation of the frequency of dictator’s return choices, in percentage terms, for different categories of recipient’s expectations (), from Never to Often (Always is omitted because only one observation is available). As an example, the height of the bar in correspondence to Never captures the relative share of dictators returning the wallet when the recipient believes that a dictator will never return the wallet. Different panels capture different restoring probabilities ()

