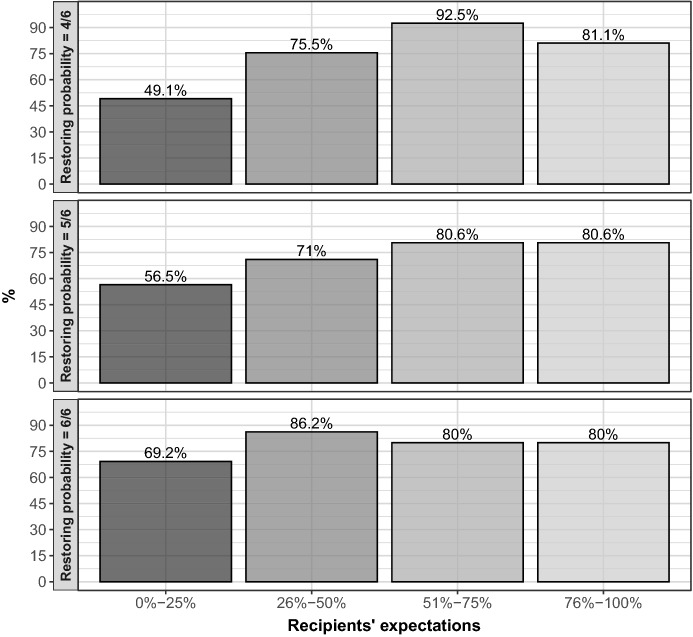
Fig. 5.
Return choices by recipients’ expectations and restoring probabilities—Robustness check. Each barplot provides a representation of the frequency of return choices, in percentage terms, for different categories of first-order expectations of recipients (), from 0–25% to 76–100%. As an example, the height of the bar in correspondence to 0–25% captures the relative share of external spectators returning the wallet when the recipient believes that a generic eternal spectator is very unlikely to return the wallet. Different panels capture different restoring probabilities ()

