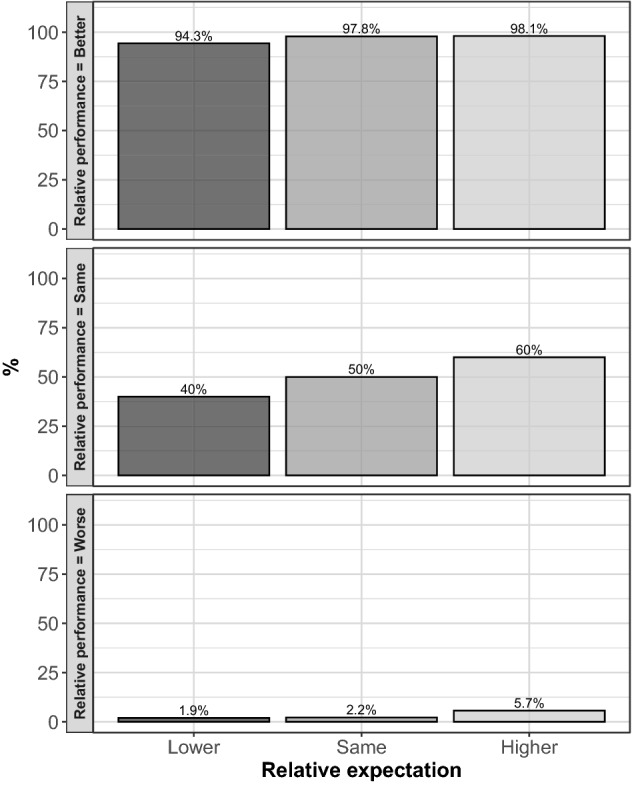
Fig. 6.

Reward choices by relative efforts and expectations. Each barplot provides a representation of the relative frequency, in percentage terms, of reward choices for different relative expectations of recipients, from lower to higher. As an example, the height of the bar in correspondence to lower captures the share of workers being rewarded when they have lower expectations than those of the other worker they are matched with. Different panels capture different levels of relative performances
