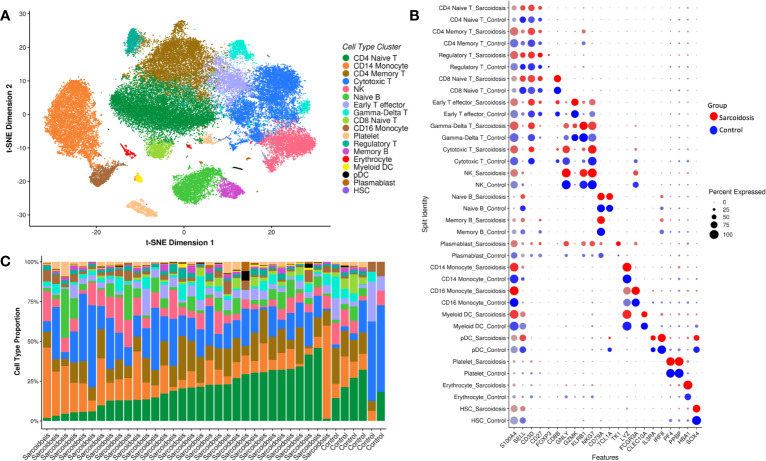
Figure 1.
Eighteen cell types identified from PBMCs. Single-cell RNA-seq data is visualized by t-SNE plot of 53,756 human PBMCs colored by predicted cell type (A). (B) Expression of marker genes of cell type by both average normalized expression (intensity of color) and percent of cells in that type expressing the marker gene (size of circle) in both sarcoidosis patients (red) and controls (blue). Bar charts (C) display the relative abundances of cells per type in patients and healthy controls that contributed at least 20 cells. While cell composition varies across individual, most subjects show large populations of CD4 T cells (dark green and brown), cytotoxic T cells (medium blue), CD14 monocytes (orange), and NK cells (pink).

