Figure 6.

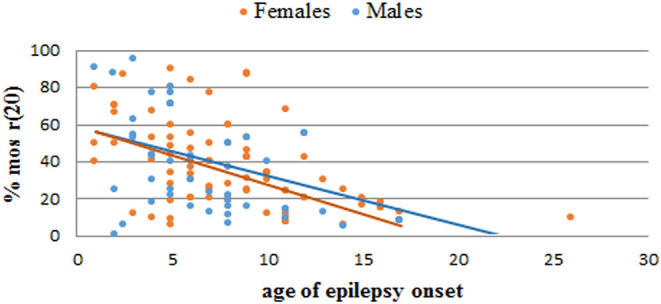
Graph showing the correlation between the percentage of r(20) mosaicism and the age of epilepsy onset in reported female (orange) and male (blue) patients with r(20). The linear interpolations are indicated.

Graph showing the correlation between the percentage of r(20) mosaicism and the age of epilepsy onset in reported female (orange) and male (blue) patients with r(20). The linear interpolations are indicated.