FIGURE 3.
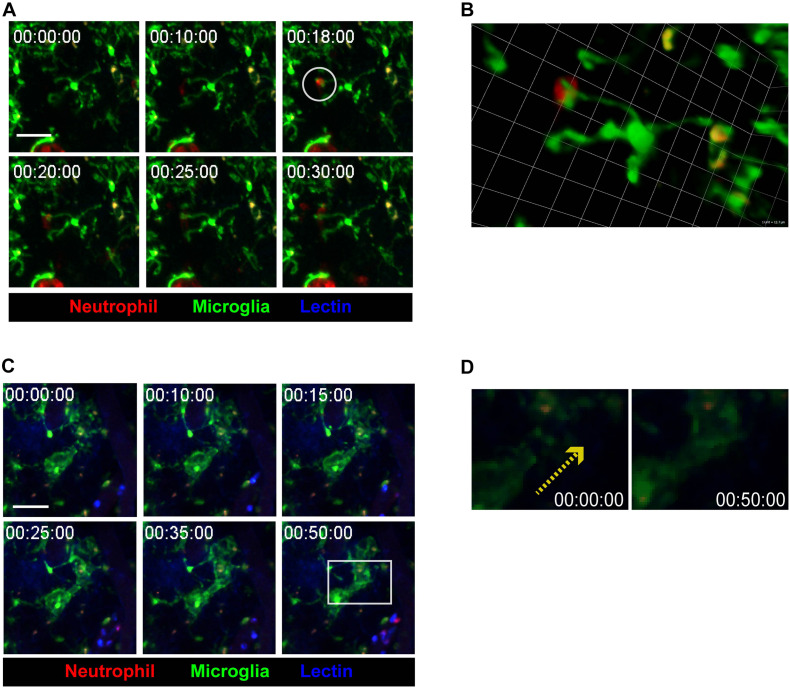
Crosstalk between microglia and neutrophils in inflamed brain parenchyma. CX3CR1GFP/+ mice were used to visualize microglia (green) in brain parenchyma using TPIM. CF405M-conjugated lectin was i.v. injected to stain blood vessels (blue). PE-conjugated anti-Ly6G antibody was i.v. injected to label neutrophils (red). (A) A series of representative time-lapse images showing contact between microglia and neutrophils (white circle). Scale bar, 40 μm (see Supplementary Video 5). (B) Magnification of a region of interest, indicated by a white circle in (A), in 3D. Scale bar per 1 unit. Scale bar, 12.7 μm. (C) A series of representative time-lapse images showing elongation of microglial processes toward site neutrophil-microglial contact (white square). Scale bar, 40 μm (see Supplementary Video 6). (D) Direction of microglial process elongation from 0 to 50 min (yellow-dotted arrow).

