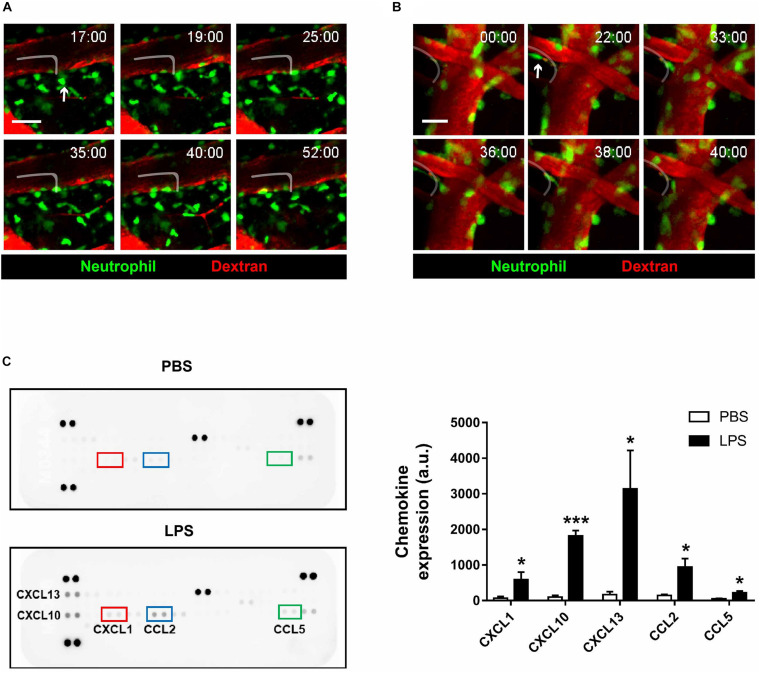
FIGURE 4.
Reverse-transendothelial migration of neutrophils in inflamed brain parenchyma. LysMGFP/+ mice were used to visualize neutrophils (green) during neuroinflammation. Texas red dextran was i.v. injected to stain blood vessels (red). (A) A series of representative time-lapse images showing neutrophil crawling along the perivascular region in inflamed brain parenchyma. Tracking of neutrophil (white line). Scale bar, 50 μm (see Supplementary Video 7). (B) A series of representative time-lapse images showing reverse-transendothelial migration of neutrophils from brain parenchyma into blood vessels. Tracking of neutrophil (white line). Scale bar, 20 μm. (C) Brain chemokine array results demonstrating altered expression levels of chemokines following LPS injection. Data indicate mean ± SEM using Student’s t-test (*p < 0.005, ***p < 0.001). Three independent experiments were performed.

