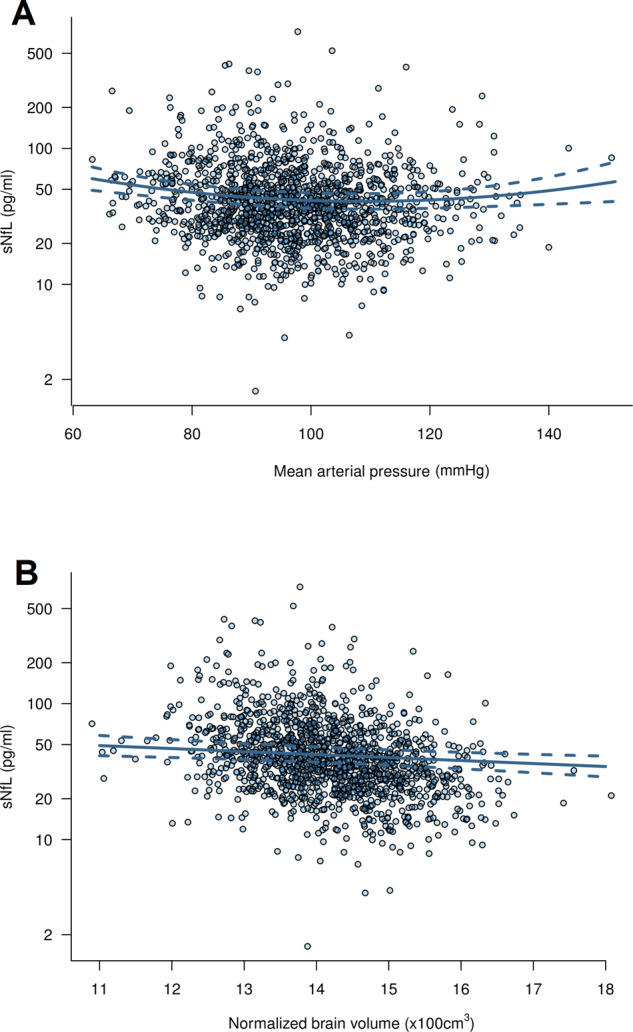
Figure 3.

Scatter plot of the association of (A) mean arterial pressure and (B) normalized brain volume with sNfL. The solid line represents the predicted values from the combined clinical and MRI model and the dashed lines represent the 95% pointwise confidence intervals.
