Figure 5.

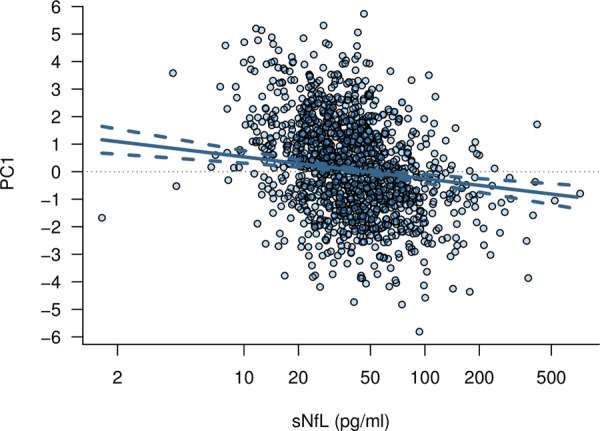
Scatter plot of the age-adjusted association of sNfL with PC1. The solid line represents the model-based predicted values and the dashed lines represent the pointwise 95% confidence intervals.

Scatter plot of the age-adjusted association of sNfL with PC1. The solid line represents the model-based predicted values and the dashed lines represent the pointwise 95% confidence intervals.