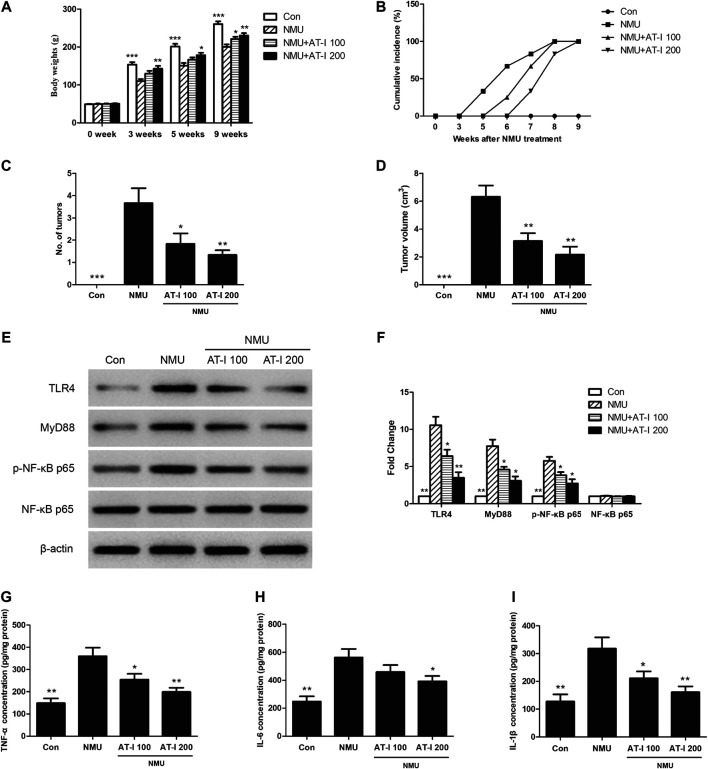
FIGURE 7.
AT-I inhibited NMU-induced rat breast cancer. The NMU-induced rats were treated with control or AT-I for 9 weeks. (A) Body weights of rats in all groups at 0, 3, 5 and 9 weeks. (B) Palpable tumor incidence was recorded every week. (C) Average tumor number at 9 week. (D) Average tumor volume at 9 week. (E, F) Rat breast tissues were kept to detect TLR4/NF-κB pathway by western blot assay at the end of experiment. (G, H, I) TNF-α, IL-6 and IL-1β levels in rat breast tissues were analyzed by ELISA at the end of experiment. Significant differences between different groups were indicated as *p < 0.05, **p < 0.01, ***p < 0.001, vs. the NMU group, n = 6.

