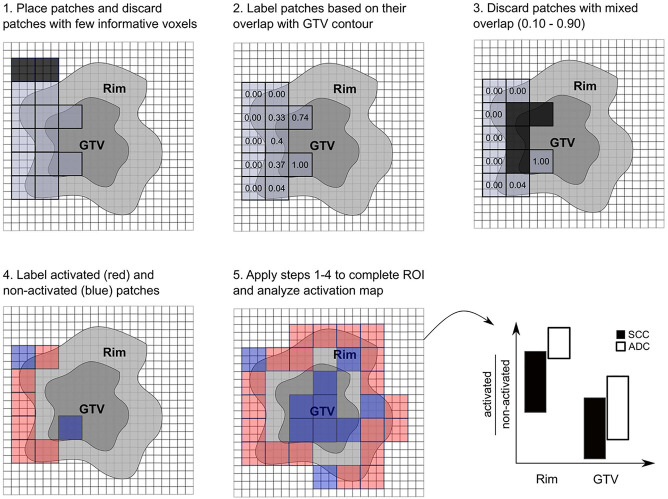
Figure 2.
Scheme of radiomics feature activation map creation. Patches were optimally placed and patches with few informative voxels (< 9) were discarded (1), patches were labeled according to their overlap with the gross tumor volume (GTV) contour (2), and patches with mixed overlap were discarded (3). Patches were labeled activated (red) if their feature value was larger than the global median and were labeled non-activated (blue) if their feature value was smaller than the global median. The activation ratio was analyzed per region and histological subtype (5).

