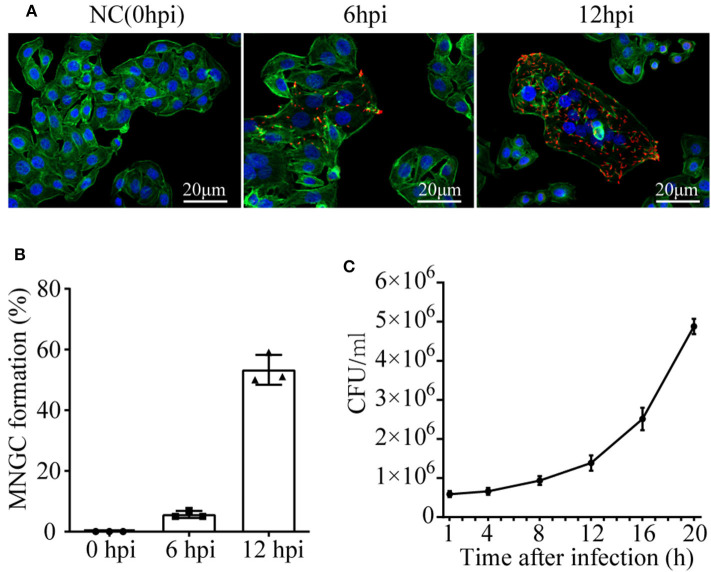
Figure 1.
MNGC formation and B. pseudomallei intracellular growth in A549 cells. (A) Confocal microscope shows the formation of MNGCs induced by B. pseudomallei at different infected times. Red is the B. pseudomallei indicated by Alexa Fluor 568, blue is the nucleus indicated by DAPI, and green is the cytoskeleton protein actin indicated by Actin-Tracker Green. (B) The percentage of MNGC formation was shown at 0, 6, and 12 hpi. (C) Intracellular growth of B. pseudomallei in A549 cell lines was assayed at different time points (1–20 h) following the initial 2 h infection with a MOI of 10. Three replicates were used for each time point. Bars represent the standard deviation of three replicates.

