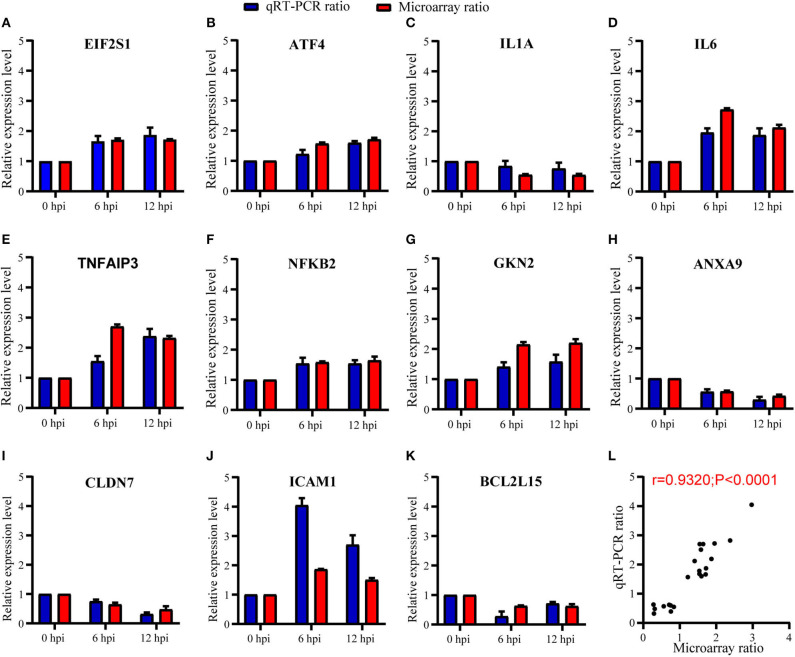
Figure 5.
Expression level of host genes in A549 cells verified using RT-qPCR. (A–K) The relative expression level of each mRNA transcript was represented as the n-fold change relative to NC (0 hpi). EIF2α and ATF4 were verified in PERK-mediated unfolded protein response; IL1A, IL6, TNFAIP3, NFκB2, and GKN2 were verified in inflammatory responses; ANXA9, CLDN7, and ICAM1 were verified in cell migration; and BCL2L15 were verified in apoptosis. All data are presented as mean ± SD (n = 3 in each time point). (L) The correlation of expression level between GeneChip™ microarray and RT-qPCR was high and significant (Pearson's r = 0.93; P < 0.0001).

