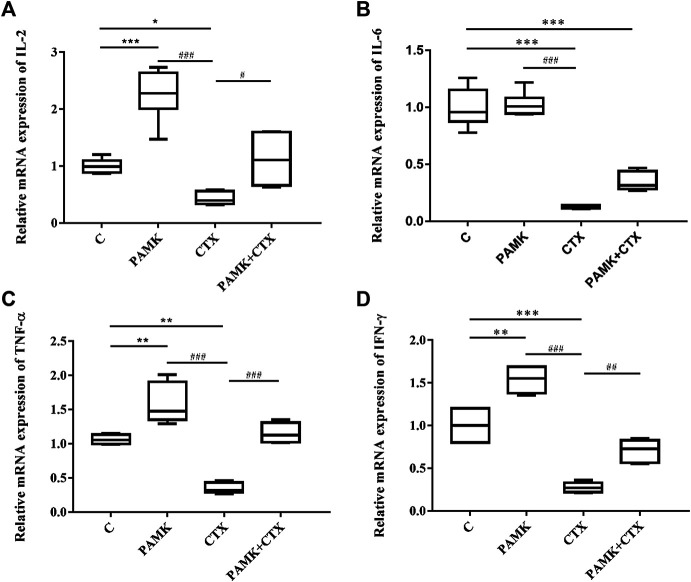
FIGURE 8.
Effects of PAMK on cytokines in mice treated with CTX. Relative mRNA expression of (A) IL-2, (B) IL-6, (C) TNF-α, and (D) IFN-γ. Data are expressed as the means ± SD, n = 6. *p < 0.05, **p < 0.01, ***p < 0.001, compared with the C group; # p < 0.05, ## p < 0.01, ### p < 0.001, compared with the CTX group.

