
FIGURE 2.
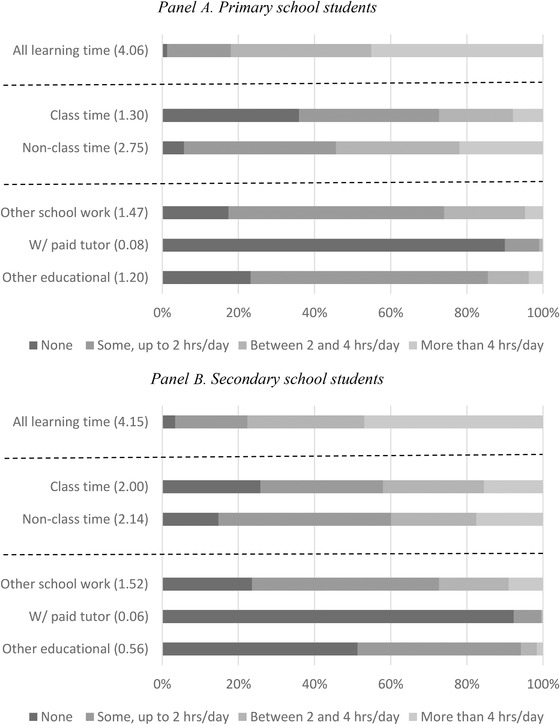
Distribution of time spent on educational activities on a ‘school’ day (from recall questions)
Note: These statistics are computed for a sample of children including those who did not attend school the day before their parents answered the survey, who have valid time‐diary responses and non‐missing answers to the recall questions, and whose total learning time was less than or equal to 12 hours. ‘All learning time’ is the sum of class and non‐class time. ‘Non‐class time’ is the sum of ‘other school work’, ‘w/ paid tutor’ and ‘other educational’. Numbers in parentheses are average hours spent.