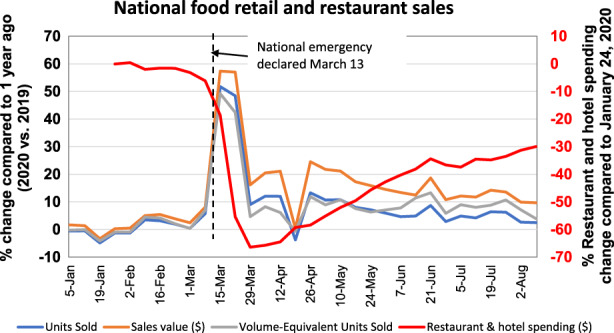
Figure 1.

Provides data on percentage change in national food retail sales & food service transactions between January and September 2020 compared with one year ago. The figure shows the immediate and drastic drop in food demand by restaurants and hotel customers, after the national emergency measures were declared in March in response to COVID‐19. Variables included are: units sold, volume‐equivalent units sold, sales revenue, and number of food service transactions. Data: USDA‐ERS calculations using data from IRI and NPD Crest Performance Alerts. [Color figure can be viewed at wileyonlinelibrary.com]
