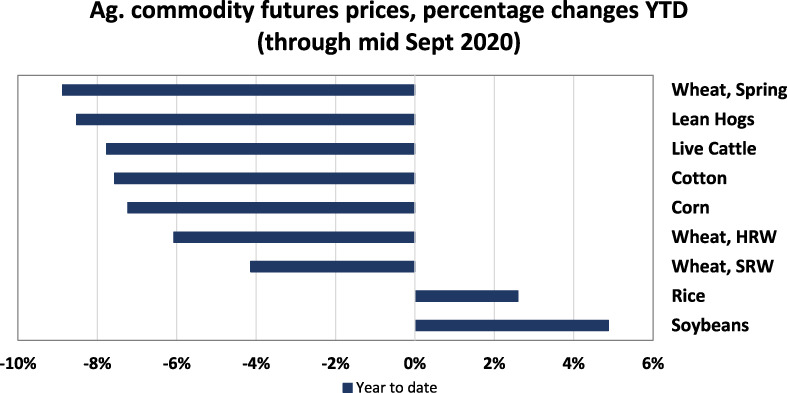
Figure 2.

The bar chart shows percentage change in agricultural commodity futures prices through mid‐September 2020 compared to one year ago. The prices of field crops and livestock declined significantly through the spring and summer of 2020. Variables included are: prices change for wheat, lean hogs, live cattle, cotton, corn, wheat HRW, wheat SRM, rice and soybeans. Data: Chicago Board of Trade, Intercontinental Exchange, Minneapolis Grain Exchange. Data compiled by Bloomberg (2020). [Color figure can be viewed at wileyonlinelibrary.com]
