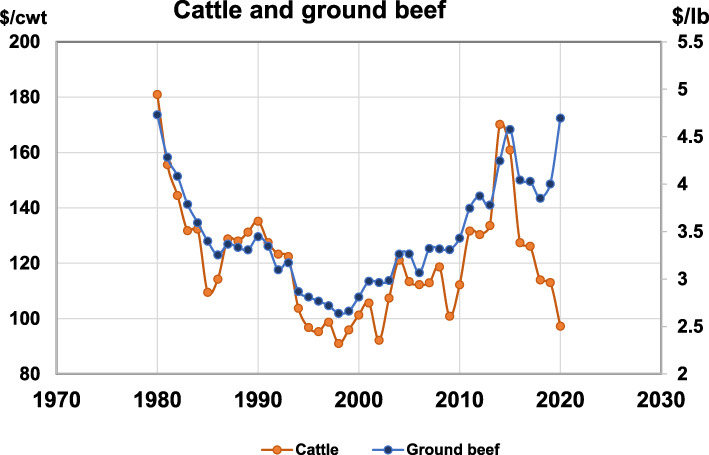
Figure 3.

Line chart shows data on differences in prices at the farm and retail levels since and shows that wide gap between prices received by producers and those seen by consumers. Prices shown are in $/CWT for ground beef and cattle. Data: U.S. Bureau of Labor Statistics (2020) and USDA National Agricultural Statistical Service [Color figure can be viewed at wileyonlinelibrary.com]
