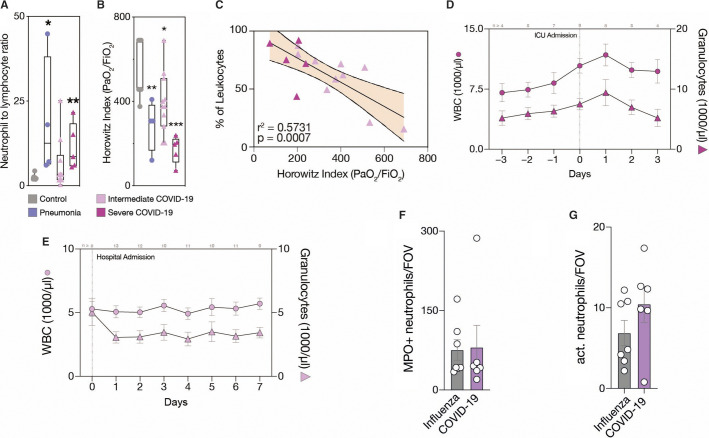
Figure 1.
COVID‐19 presents dynamic adaptive and innate immunity changes in the peripheral blood. A, Neutrophil‐to‐lymphocyte ratio (NLR) and (B), Horowitz index (PaO2/FiO2) for each patient group. Box‐and‐whiskers plot, two‐tailed unpaired t‐test comparing groups to control (Ctrl). n = 7 Ctrl_healthy, n = 4 Ctrl_pneu, n = 11 CoV_int, n = 5 CoV_sev patients. C, Linear regression of neutrophils with Horowitz index. n = 11 CoV_int, n = 5 CoV_sev. Shaded area is 95% confidence interval. D, E, Time course of daily white blood cell count (WBC) and granulocyte count for CoV_int and CoV_sev normed on hospital or intensive care unit admission. Data is mean ± standard error of the mean (SEM), n per time point is shown above graphs in gray. n = 14 CoV_sev, n = 15 CoV_int. F, Number of neutrophils per field of view in lung sections (FOV). G, Number of activated (citH3+) neutrophils per FOV. F–G, Mean of five high power fields was taken for each sample. n = 6 COVID‐19, n = 7 Influenza. Error bars are SEM. * P ≤ .05, ** P ≤ .01, *** P ≤ .001

