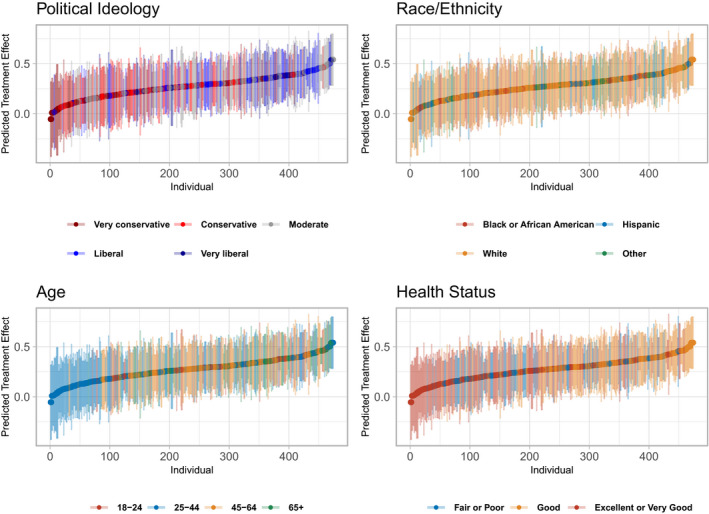
Figure 3.

Causal forest assessment of treatment effect heterogeneity on perceived message effectiveness by participant characteristics. Treatment effect heterogeneity shown for perceived messaging effect outcome, ordered by predicted treatment effect size in Cohen’s D standardized units. A Cohen’s D of 0.2 is considered a small effect and 0.5 a medium effect. 39 Omnibus test for heterogeneity 40 found no significant heterogeneity in the effect (p‐value 0.26). Political ideology and age selected due to highest relative variable importance, though not statistically significant. Race/ethnicity and health status selected due to hypothesized importance, though visually and statistically no heterogeneity demonstrated.
