FIGURE 3.

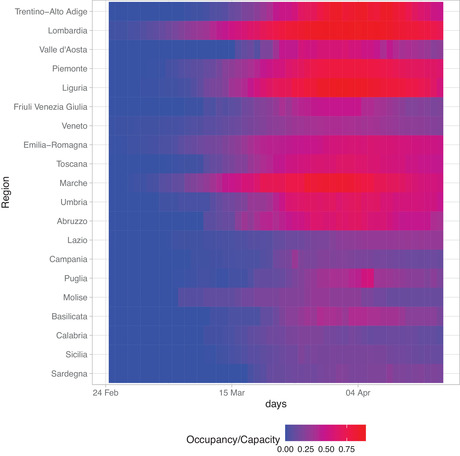
ICU rate of occupancy during the COVID‐19 epidemic in the Italian regions. Regions are ordered geographically from North to South

ICU rate of occupancy during the COVID‐19 epidemic in the Italian regions. Regions are ordered geographically from North to South