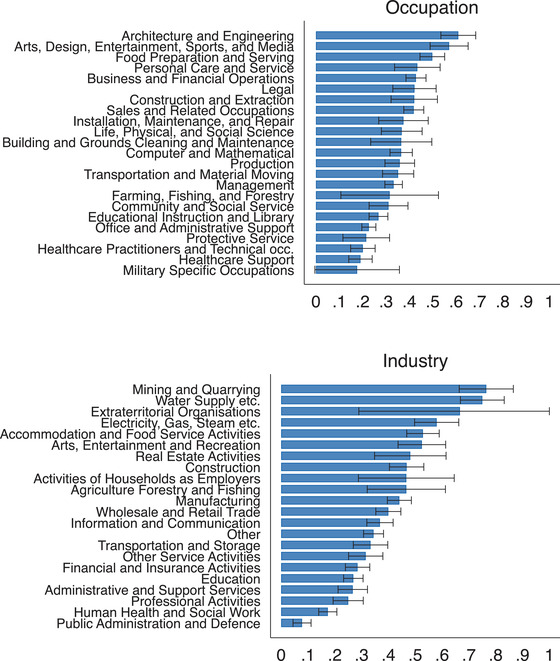
FIGURE 2.

Share of furloughed workers by occupation and industry
Note: The horizontal bars show the average share of employees who were furloughed on the survey date for each occupation (top) and industry (bottom). The black bars represent 95 per cent confidence intervals. Survey responses for the April and May survey waves are pooled in this figure.
