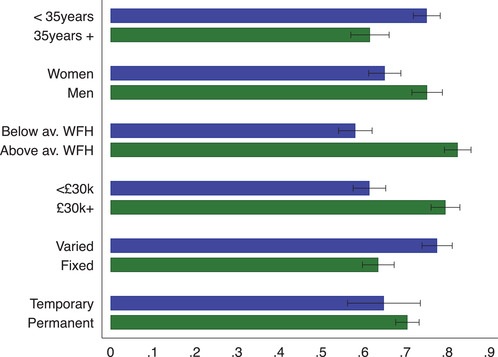
FIGURE 6.

Share of furloughed workers receiving top‐up by individual and job characteristics
Note: The graph shows the share of workers that are currently furloughed by different individual and job characteristics who report having their salary topped up beyond the 80 per cent subsidy provided by the government. Black bars represent 95 per cent confidence intervals. The sample is restricted to respondents to the April survey wave. ‘Below av. WFH’ are employees who can do less than average tasks from home, while ‘Above av. WFH’ are employees who can do more than average tasks from home. ‘£30k’ refers to respondents with a yearly gross individual income below £30,000 in 2019, while ‘£30k+’ are those earning more. ‘Varied’ refers to respondents with variable‐hour contracts, while ‘fixed’ refers to those with fixed‐hour contracts.
