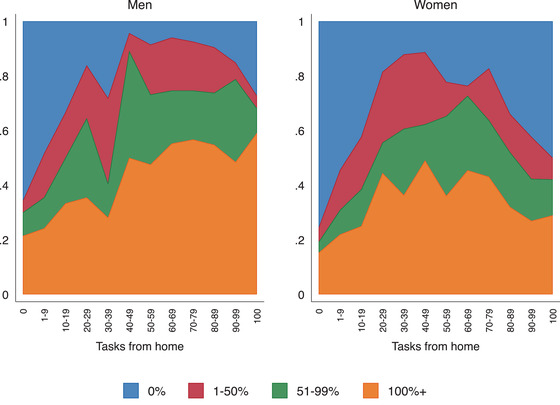
FIGURE 7.

Percentage of usual hours worked while furloughed by the percentage of tasks that can be done from home
Note: The graph shows the percentage of typical work hours worked in the previous week by respondents who are currently furloughed, by the percentage of tasks that can be done from home. Survey responses for the April and May survey waves are pooled in this figure.
