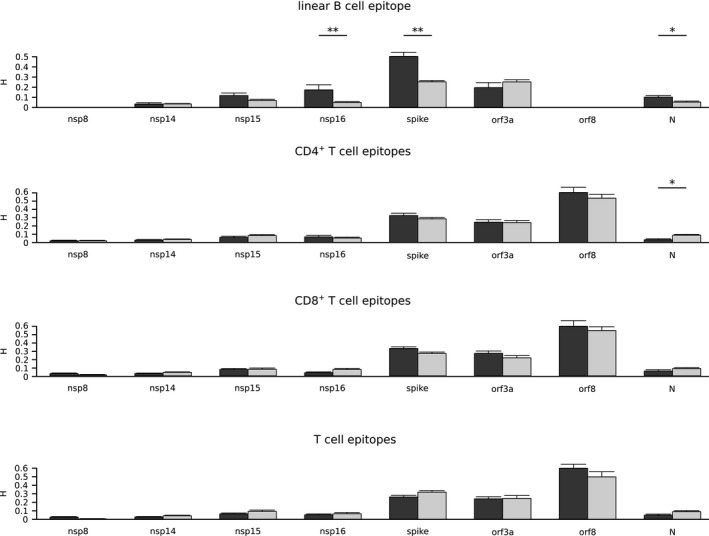
FIGURE 3.

Variability of epitope and nonepitope positions among sarbecoviruses. Shannon's entropy (H) mean values along with standard errors are shown for a set of sarbecovirus ORFs. SARS‐CoV‐2 epitope positions are shown in dark grey and nonepitopes in light grey. Significant comparisons, calculated by a permutation approach, are indicated with asterisks (*p < .05; ** p < .01; *** p < .001)
