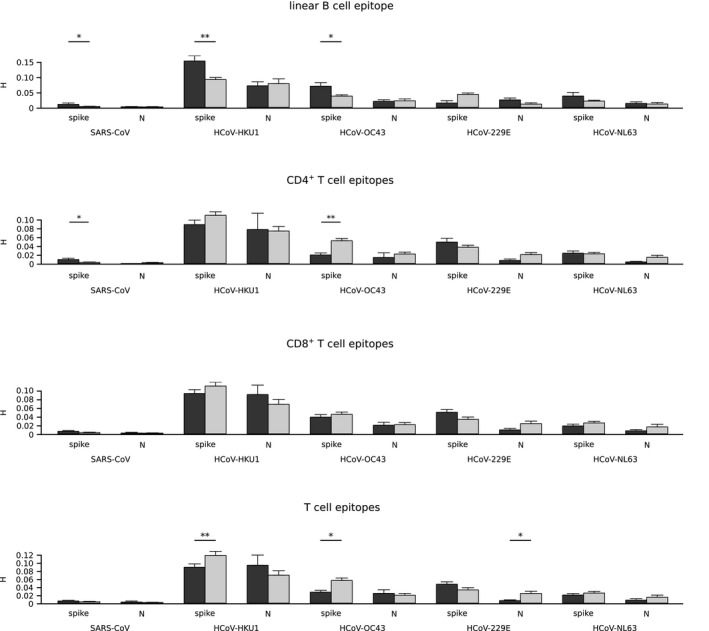
FIGURE 4.

Variability of epitope and nonepitope positions among human coronaviruses. Shannon's entropy (H) mean values along with standard errors are shown for human coronavirus spike and nucleocapsid proteins. Epitope positions are shown in dark grey and nonepitopes in light grey. Significant comparisons, calculated by a permutation approach, are indicated with asterisks (*p < .05; ** p < .01; *** p < .001)
