Figure 1.

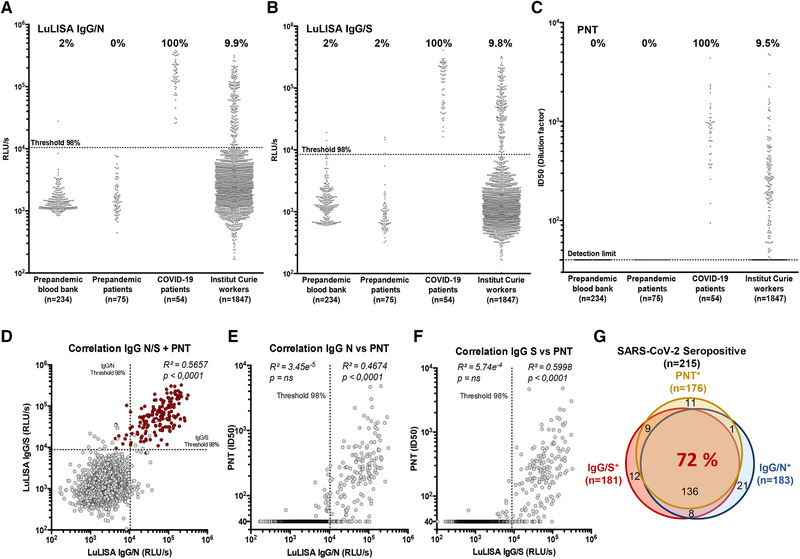
Serological responses to SARS‐CoV‐2 among Institut Curie workers using LuLISA IgG/N, IgG/S, and PNT assays. (A–C) Sera from prepandemic samples from healthy donors (blood bank), prepandemic patients (breast cancer), COVID‐19 patients (RT‐PCR positive), and Institut Curie workers were evaluated in LuLISA IgG/N (A) or IgG/S (B) and PNT (C) assays. For LuLISA, raw values are represented. Sera were considered positive for anti‐N or ‐S IgG if the value was above the 98% threshold (See Supporting Information Fig. S1 for calculation details). For PNT assay, values after ID50 calculation are represented (see Supporting Information Fig. S3 for calculation details and Fig. S7 for raw values). Negative sera are represented with an ID50 below detection limit (40). Percentages of positive are indicated above each series. (D) Correlation plots between LuLISA IgG/N, IgG/S, and PNT (red dots) or between PNT and LuLISA IgG/N (E) or IgG/S (F). Thresholds at confidence index of 98% are shown (dotted lines). Correlation coefficients (R 2) and associated p values from Pearson test (one‐tailed) are indicated above each corresponding area. Numerical values of each combination of assays are summarized with a Venn diagram (G) in overlapping areas. Proportion (%) of triple‐positive individuals is indicated in red.
