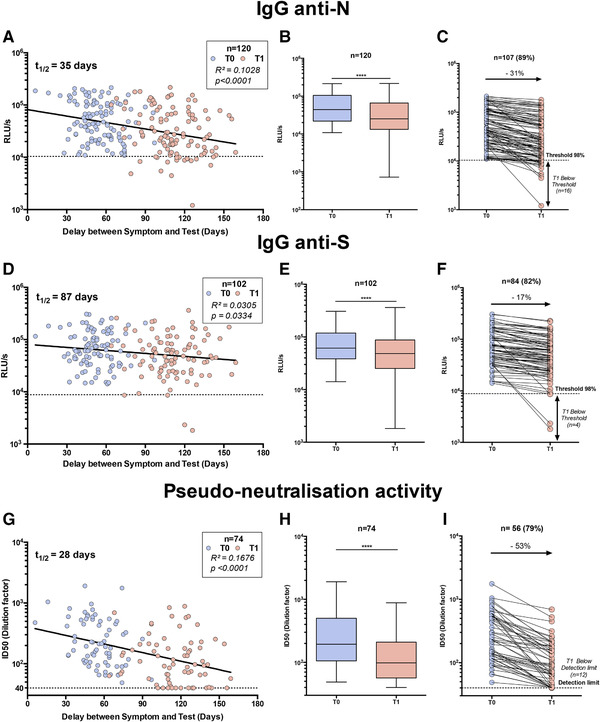
Figure 3.

Serological profile follow‐up overtime. Workers whose serum was positive for IgG anti‐N (A–C), anti‐S (D–F), and pseudo‐neutralization activity (G–I) at the first blood sampling (t 0) were reassessed together with serum obtained 6–12 weeks later (t1 ). (A–G) Test values according to delay between date of symptom onset and the two serum analyses: t 0 (blue dots) and t 1 (red dots). Linear regression is plotted. Coefficient of determination and associated p value are indicated. (B–H) Whisker‐plots summarizing test value for both tests (t 0 and t 1). Statistical significance was determined using a Wilcoxon test (****p < 0.0001). (C–I) Individual follow‐up of seropositive workers with a decreasing value. Variation of mean (t 0 /t 1) is indicated in %.
