
Figure 1.
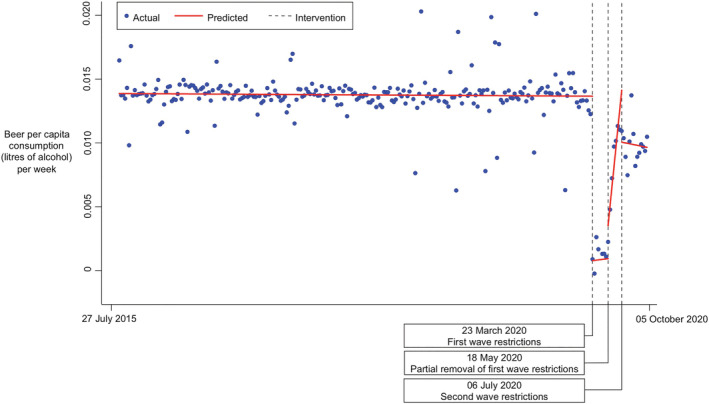
Interrupted time–series analysis: on‐premises beer per capita consumption per week in Australia before and after first and second wave of COVID‐19 restrictions. [Colour figure can be viewed at wileyonlinelibrary.com]
Official websites use .gov
A
.gov website belongs to an official
government organization in the United States.
Secure .gov websites use HTTPS
A lock (
) or https:// means you've safely
connected to the .gov website. Share sensitive
information only on official, secure websites.
Interrupted time–series analysis: on‐premises beer per capita consumption per week in Australia before and after first and second wave of COVID‐19 restrictions. [Colour figure can be viewed at wileyonlinelibrary.com]