FIGURE 5.

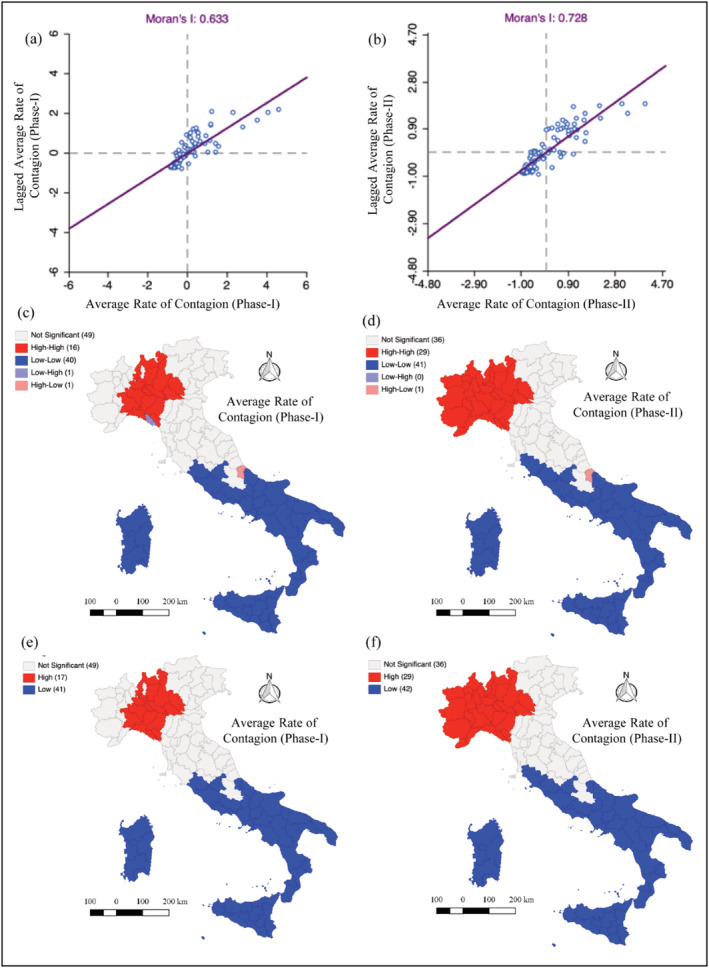
Global Moran and Moran scatterplot for (a) “phase‐I”, and (b) “phase‐II”, local Moran and LISA clusters for (c) “phase‐I”, (d) “phase‐II”, and hot and cold spots calculated via Getis‐Ord G for (e) “phase‐I”, (f) phase‐II

Global Moran and Moran scatterplot for (a) “phase‐I”, and (b) “phase‐II”, local Moran and LISA clusters for (c) “phase‐I”, (d) “phase‐II”, and hot and cold spots calculated via Getis‐Ord G for (e) “phase‐I”, (f) phase‐II