FIGURE 7.

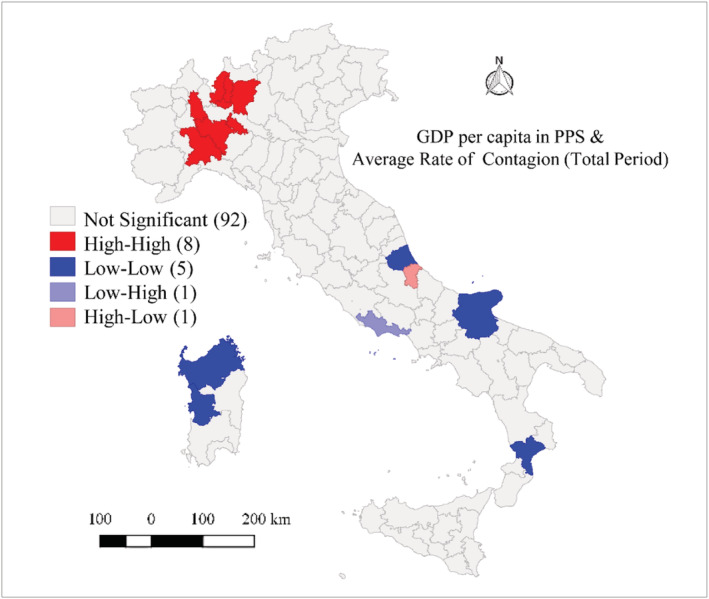
Bivariate LISA between GDP per capita in PPS and average of total case per day at province level. elaboration made over the whole period

Bivariate LISA between GDP per capita in PPS and average of total case per day at province level. elaboration made over the whole period