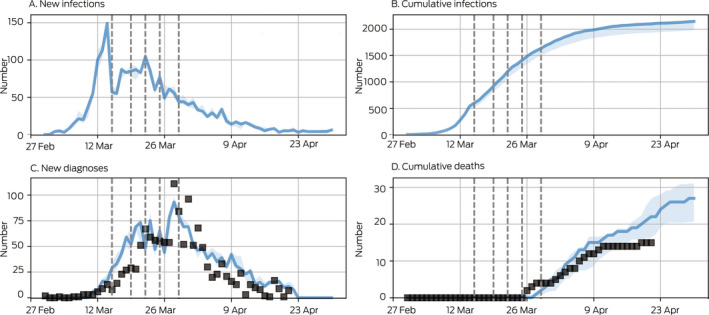
The probability of transmission per contact was varied such that the model matched the observed number of diagnoses and deaths over time. Baseline projections (blue) included policy changes on 19, 21, 22 and 29 March (dashed vertical lines; Supporting Information, F). Black squares represent data; blue lines and shaded areas are model projections (median and interquartile range for 100 simulations). Data were only available for new diagnoses, whereas the model also projects new infections. We estimated that by 30 April about 2000 people were COVID‐19‐positive, of whom about 1600 (80%) had been diagnosed. Most undiagnosed cases were asymptomatic infected persons.
