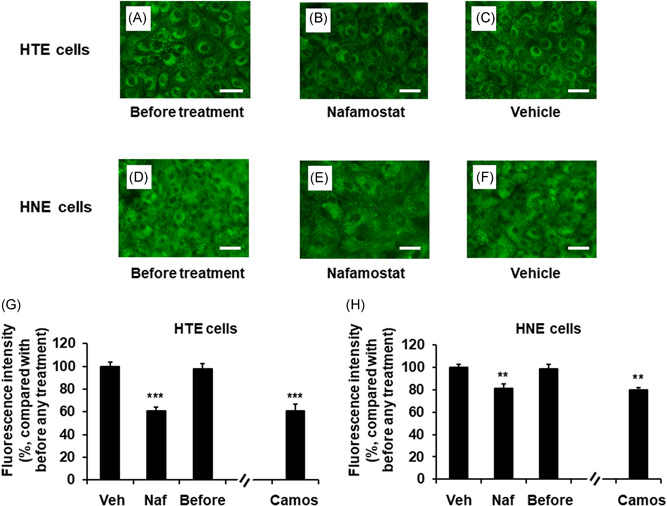
Figure 3.

A–F, Changes in the distribution of acidic endosomes exhibiting green fluorescence in uninfected HTE (A–C) or HNE (D–F) cells at 72 h after treatment with Naf (10 μg/ml) (B and E) or Veh (C and F) or untreated cells cultured in medium alone (before treatment) (A and D) (scale bar = 100 μm). G and H, The effects of treatment with Naf (10 μg/ml), Veh, or Camos (10 μg/ml) on the fluorescence intensity of acidic endosomes in HTE cells (G) and HNE cells (H) at 72 h after treatment or in untreated cells (before treatment; before). The results are expressed as the relative intensity (%) compared to the mean intensity value of the vehicle‐treated cells. The results are expressed as the mean ± SEM for seven tracheal or nasal mucosa tissue samples. Camos, camostat; HNE, human nasal; HTE, human tracheal; Naf, nafamostat; Veh, vehicle. Significant differences versus values from the cells treated with Veh are indicated by **p < .01 and ***p < .001
