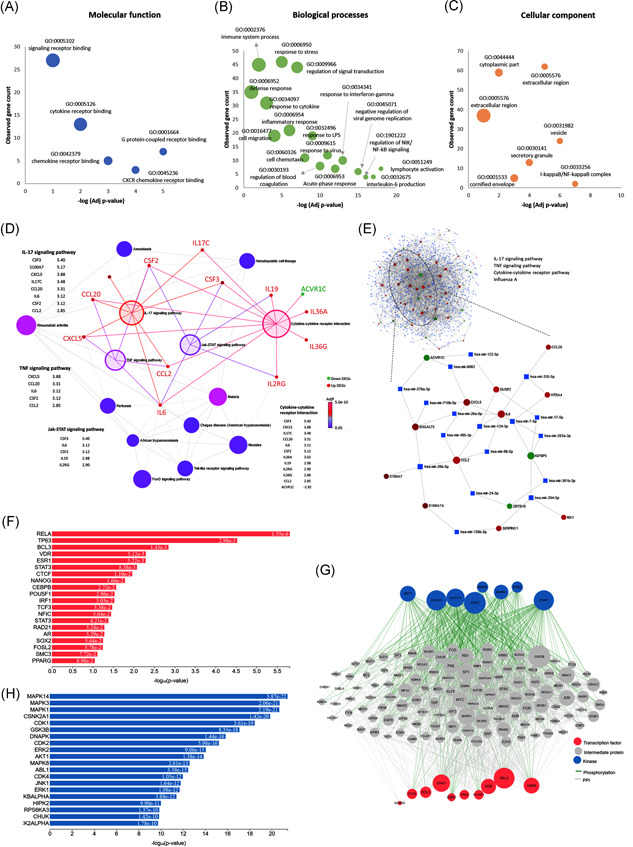
Figure 2.

Functional enrichment analysis and gene regulatory networks. (A) Gene ontology analysis for molecular function, (B) for biological processes, (C) for cellular components, (D) The Kyoto Encyclopedia of Genes and Genomes (KEGG) pathway enrichment analysis. Nodes represented pathways, with color based on its significance. Four enlarged highlighted nodes represented the most significant pathways. Bipartite gene networks with these nodes showed the association with upregulated (red) and downregulated (green) genes. (E) Gene–microRNA interaction. The data source for interaction pairs: TarBase and miRTarBase. Red and green circles represented upregulated and downregulated differentially expressed genes, respectively. Blue squares represented the microRNAs. The full network is shown with extracted nodes (ellipse) for four significant KEGG pathways. (F) Transcription factor enrichment analysis showing putative transcription factors that most likely to regulate the differences in gene expression. (G) Upstream regulatory network that connects the enriched transcription factors to kinases through known protein–protein interactions. (H) Kinase enrichment analysis. Candidate enriched protein kinases that most likely regulate the formation of the identified transcriptional complexes. They are ranked based on the overlap between known kinase‐substrate phosphorylation interactions and the proteins in the protein–protein interaction subnetwork created in (G)
