FIGURE 2.

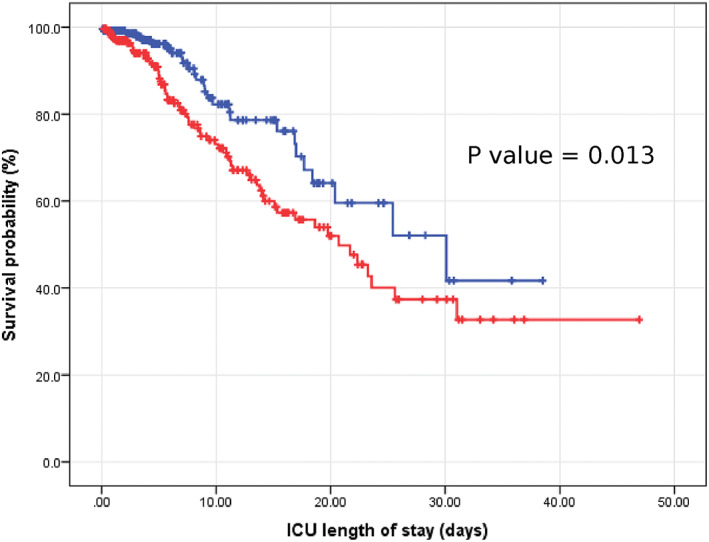
Kaplan‐Meier curve for survival probability in the hyperglycemic group and the normoglycemic group. ICU, Intensive Care Unit

Kaplan‐Meier curve for survival probability in the hyperglycemic group and the normoglycemic group. ICU, Intensive Care Unit