
Figure 6.
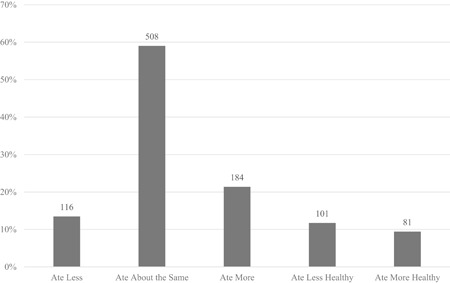
Changes in dietary patterns during COVID‐19 (% of respondents). Question:How much has your diet changed since COVID‐19 started?. Participants could enter multiple answers. y‐axis indicates percentage of respondents who selected each response while data labels indicate number of respondents (total number of survey particiapnts = 861)