
Figure 2.
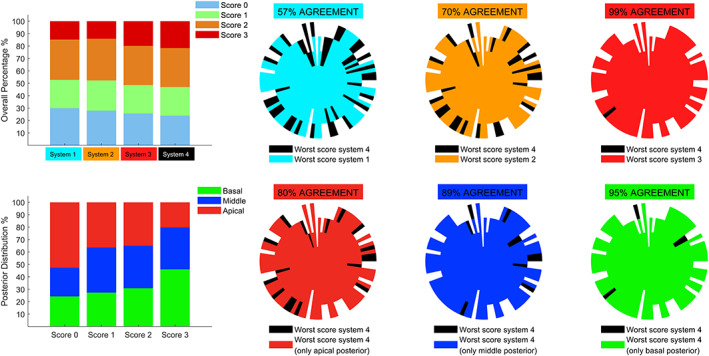
The overall distribution of score considering the 4 systems is depicted on the top left. The level of agreement between systems 1, 2, and 3 with respect to system 4 is also shown on the top. (For further details about the structure of agreement graphs, see Smargiassi et al. 5 ) The distribution of each score in the posterior areas (basal, middle, and apical) is also depicted on the bottom left. The level of agreement between the 3 modified versions of system 4 (10 zones instead of 14: ie, all of the anterior and lateral areas together with apical posteriors, middle posteriors, or basal posteriors) with respect to system 4 is also shown on the top.